Est. reading time: 5 minutes
Your marketing data is a chorus of voices—search, social, display, email, ecommerce—all singing at once. A Looker Studio dashboard turns that noise into a symphony you can conduct. Here’s your upbeat, step-by-step guide to building a cross-channel marketing dashboard that’s fast, consistent, and adored by every team that touches growth.
Kickstart Your Cross-Channel Vision in Looker Studio
Before you add a single chart, write your story. What decisions should this dashboard enable weekly, monthly, and quarterly? Define your north-star metrics (e.g., revenue, ROAS, CAC), the supporting KPIs by funnel stage (awareness, consideration, conversion, retention), and the key questions each team needs answered. Sketch a simple wireframe: an executive scorecard on top, channel trends in the middle, and deep-dive tables at the bottom.
Next, map the audience. Executives want clarity at a glance, channel managers want levers and diagnostics, and analysts want granularity and exportability. Plan for all three by organizing the report into layered pages: Overview, Channel Performance, Creative/Placement, Web & Conversion, and Budget Pacing. Establish a measurement dictionary that documents metric definitions, attribution windows, and refresh cadence—this prevents endless debates and ensures trust.
Finally, set your technical strategy. Choose whether to blend data inside Looker Studio or centralize it in a warehouse like BigQuery for heavier lifting and speed. Decide on account coverage (which brands, markets, and date ranges), ownership (who maintains connections), and performance constraints (chart count, row limits, and caching). When your intent is clear and constraints are acknowledged up front, the rest of the build feels like jazz.
Connect Data Sources and Tame Tracking Chaos
Hook up your data sources: Google Ads, GA4, Search Console, YouTube, DV360, CM360, Meta, LinkedIn, TikTok, X, email platforms, and ecommerce (Shopify, WooCommerce). Use native connectors where possible and reputable partner connectors (e.g., Supermetrics, Funnel, Power My Analytics, Windsor.ai, Porter) when needed. If your scope is large, funnel everything into BigQuery first to normalize schemas, handle multi-currency, and join safely—then connect Looker Studio to tidy, aggregated tables.
Standardize tracking before you standardize visuals. Enforce UTM conventions (source, medium, campaign, content, term), pick a canonical channel taxonomy, and align time zones and currencies. Build a channel mapping using CASE logic (e.g., map “facebook.com / paid_social” and “instagram.com / paid_social” to “Paid Social”), and unify date fields to a single grain (day). Deduplicate campaigns that differ only by casing or trailing parameters; your future self will high-five you.
Know Looker Studio’s blending limits and work around them. Blending supports left joins, a maximum of five sources, and aggregation before the join—great for quick wins but fragile for scale. For robust joins (multi-touch, creative-level, or product-level merges), prep the data in BigQuery, create materialized or scheduled views, and expose only the fields and granularity you need. When in doubt: aggregate upstream, visualize downstream.
Design KPIs and Visuals That Delight Every Team
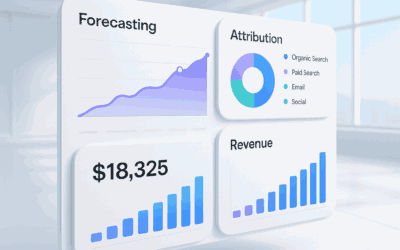
Start with a dazzling but disciplined hero section. Show total cost, revenue, ROAS/POAS, conversions, CPA, and CAC with comparisons to previous period and target. Add a time series of revenue, cost, and ROAS to reveal pacing and seasonality, plus a small alert panel using conditional formatting to flag anomalies in spend spikes, CPA surges, or conversion dips.
Serve channel managers the diagnostics they crave. Use tables with optional metrics (toggle-able columns) so users can add CTR, CPC, CPM, reach, frequency, engaged sessions, and assisted conversions without clutter. Provide cross-filters: clicking a bar in the “Channel” chart filters downstream visuals. Include pivot tables by channel x device or campaign x audience, and a creative gallery table (thumbnail, headline, spend, CTR, CVR) for rapid creative triage.
Make it feel branded and joyful. Apply your color palette consistently, limit chart types to a purposeful set (scorecards, time series, stacked bars, pivot tables), and keep whitespace generous. Add parameter controls for currency (if you support multi-market), date granularity (day/week/month), and attribution window (where supported by your data model). Every interaction should feel like a tiny “aha.”
Automate data freshness so the dashboard is always showtime-ready. In Looker Studio, set each data source’s refresh schedule—hourly or daily depending on the connector and plan—and align around your reporting time zone. For large datasets, speed up performance with BigQuery extracts, pre-aggregated tables, or the Extract Data connector; limit default date ranges and row counts to keep pages snappy.
Share with intention. Use viewer credentials when you want each user to see only what their account access allows, or owner credentials when you need broader visibility. Add row-level security on data sources where required (e.g., region or brand restrictions). Set up scheduled email delivery of PDFs to stakeholders ahead of weekly standups, and embed key pages in internal wikis or Slack using shareable links.
Close the loop with storytelling and habit. Create an “Insights” page that auto-highlights top movers (best/worst ROAS, fastest-rising CPA, new hero creatives) via conditional formatting. Annotate trends with text notes so future views have context. Celebrate wins in team meetings using the dashboard, and maintain a tiny changelog note on the Overview page so everyone sees enhancements as they ship.
A great dashboard is part instrument panel, part conversation starter. By aligning on questions, cleaning your data, designing for decisions, and automating the delivery, you’ll turn cross-channel chaos into a weekly rhythm of insight and action. Build it once with care—then let Looker Studio help your marketing fly.